Treemap Chart
Turn hierarchical query results into proportional rectangles.
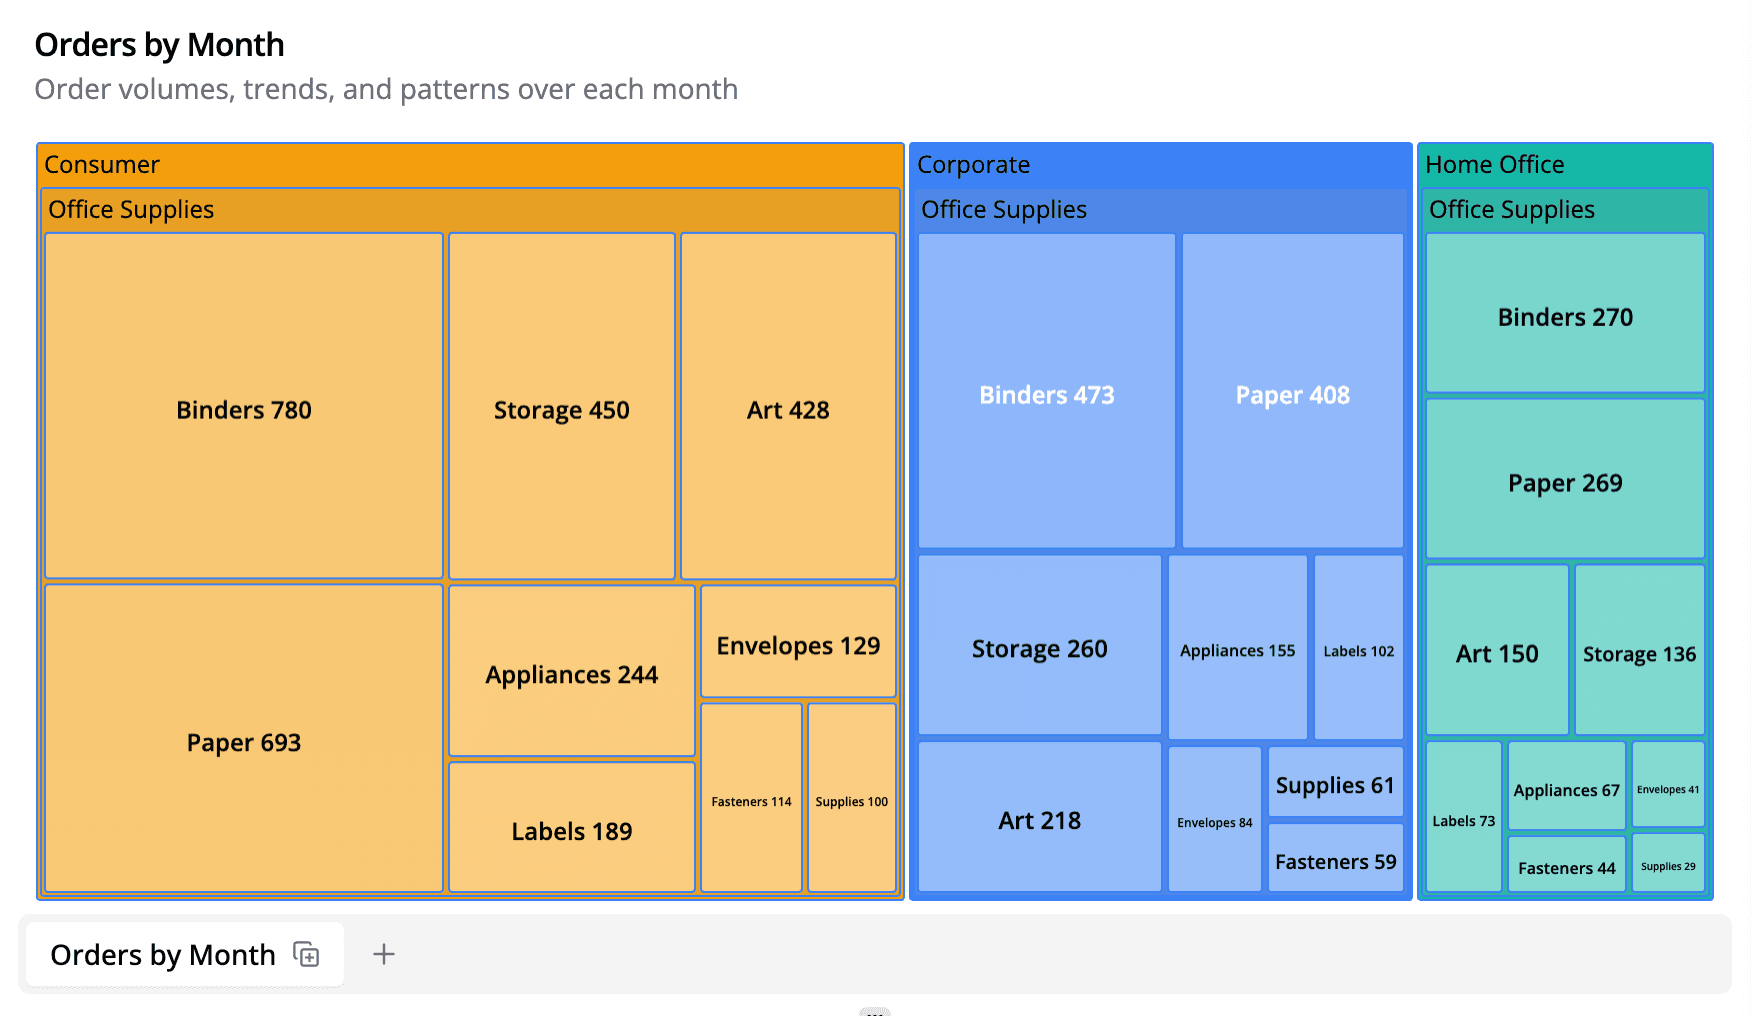
Treemaps show how a numerical value (such as revenue or volume) breaks down across one or more categorical levels. Each rectangle’s size corresponds to the metric, and additional levels create nested rectangles so you can compare parents and children in the same view.
Data Requirements
| Requirement | Details |
|---|---|
| 1–N dimensions | The first dimension becomes the top-level group; additional dimensions create nested levels. |
| 1 numeric metric | Drives the area of each rectangle. Semaphor auto-detects the metric when only one numeric column is present. |
Semaphor automatically fills blanks with (Blank) and coerces non-numeric metrics to 0 so the layout remains stable even if your query returns nulls.
Explorer Workflow (Standard Mode)
| Drop Zone | Required | Notes |
|---|---|---|
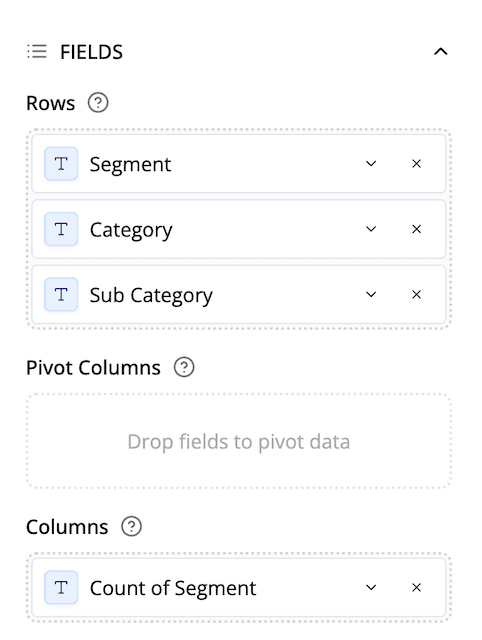
| Rows | ✅ | Add dimensions in hierarchical order (root → child → grandchild). |
| Columns | 🚫 | Not used for treemaps. |
| Metrics | ✅ | First numeric field drives area. Additional metrics are ignored. |
- Rows – Add up to three dimensions to define hierarchy (e.g.,
Category → Subcategory → SKU). The order in the Rows drop zone determines the nesting order. - Columns – The first numeric field becomes the value. Additional metrics are ignored.
- Configuration → Treemap Colors – Choose between Branch shading (default) where each branch inherits the parent color but varies in intensity, or Category colors which assigns a distinct color per top-level group.
SQL Workflow (Dev Mode)
Provide dimensions left-to-right and the metric last. Semaphor uses the first non-numeric column as the root level, the next as the child level, etc.
SELECT
  segment,
  category,
  subcategory,
  SUM(sales) AS total_sales
FROM orders
GROUP BY 1, 2, 3
ORDER BY category, subcategory;| segment | category | subcategory | total_sales |
| -------- | --------- | ----------- | ----------- |
| Consumer | Furniture | Chairs | 2771 |
| Consumer | Furniture | Tables | 3121 |
| Consumer | Office | Binders | 1893 |Switch the card type to Treemap. Semaphor automatically:
- Detects
segment→category→subcategoryas the hierarchy (three levels in this example). - Uses
total_salesfor area sizing. - Applies branch shading so all top-level segments share consistent hues.
Customization Reference
| Option | Location | What it does |
|---|---|---|
| Treemap Colors | Configuration → Treemap Colors | Choose between branch shading (varying intensity per branch) or flat colors per top level. |
| Data Labels | Configuration → Data Labels | Toggle labels, control font/size/color, and choose the value format (number, currency, etc.). |
| Legends | Configuration → Legend | Show or hide the standard legend (off by default because the treemap already shows segments). |
Best Practices
- Keep hierarchies shallow (2–3 levels max). Deep nesting makes tiles unreadable.
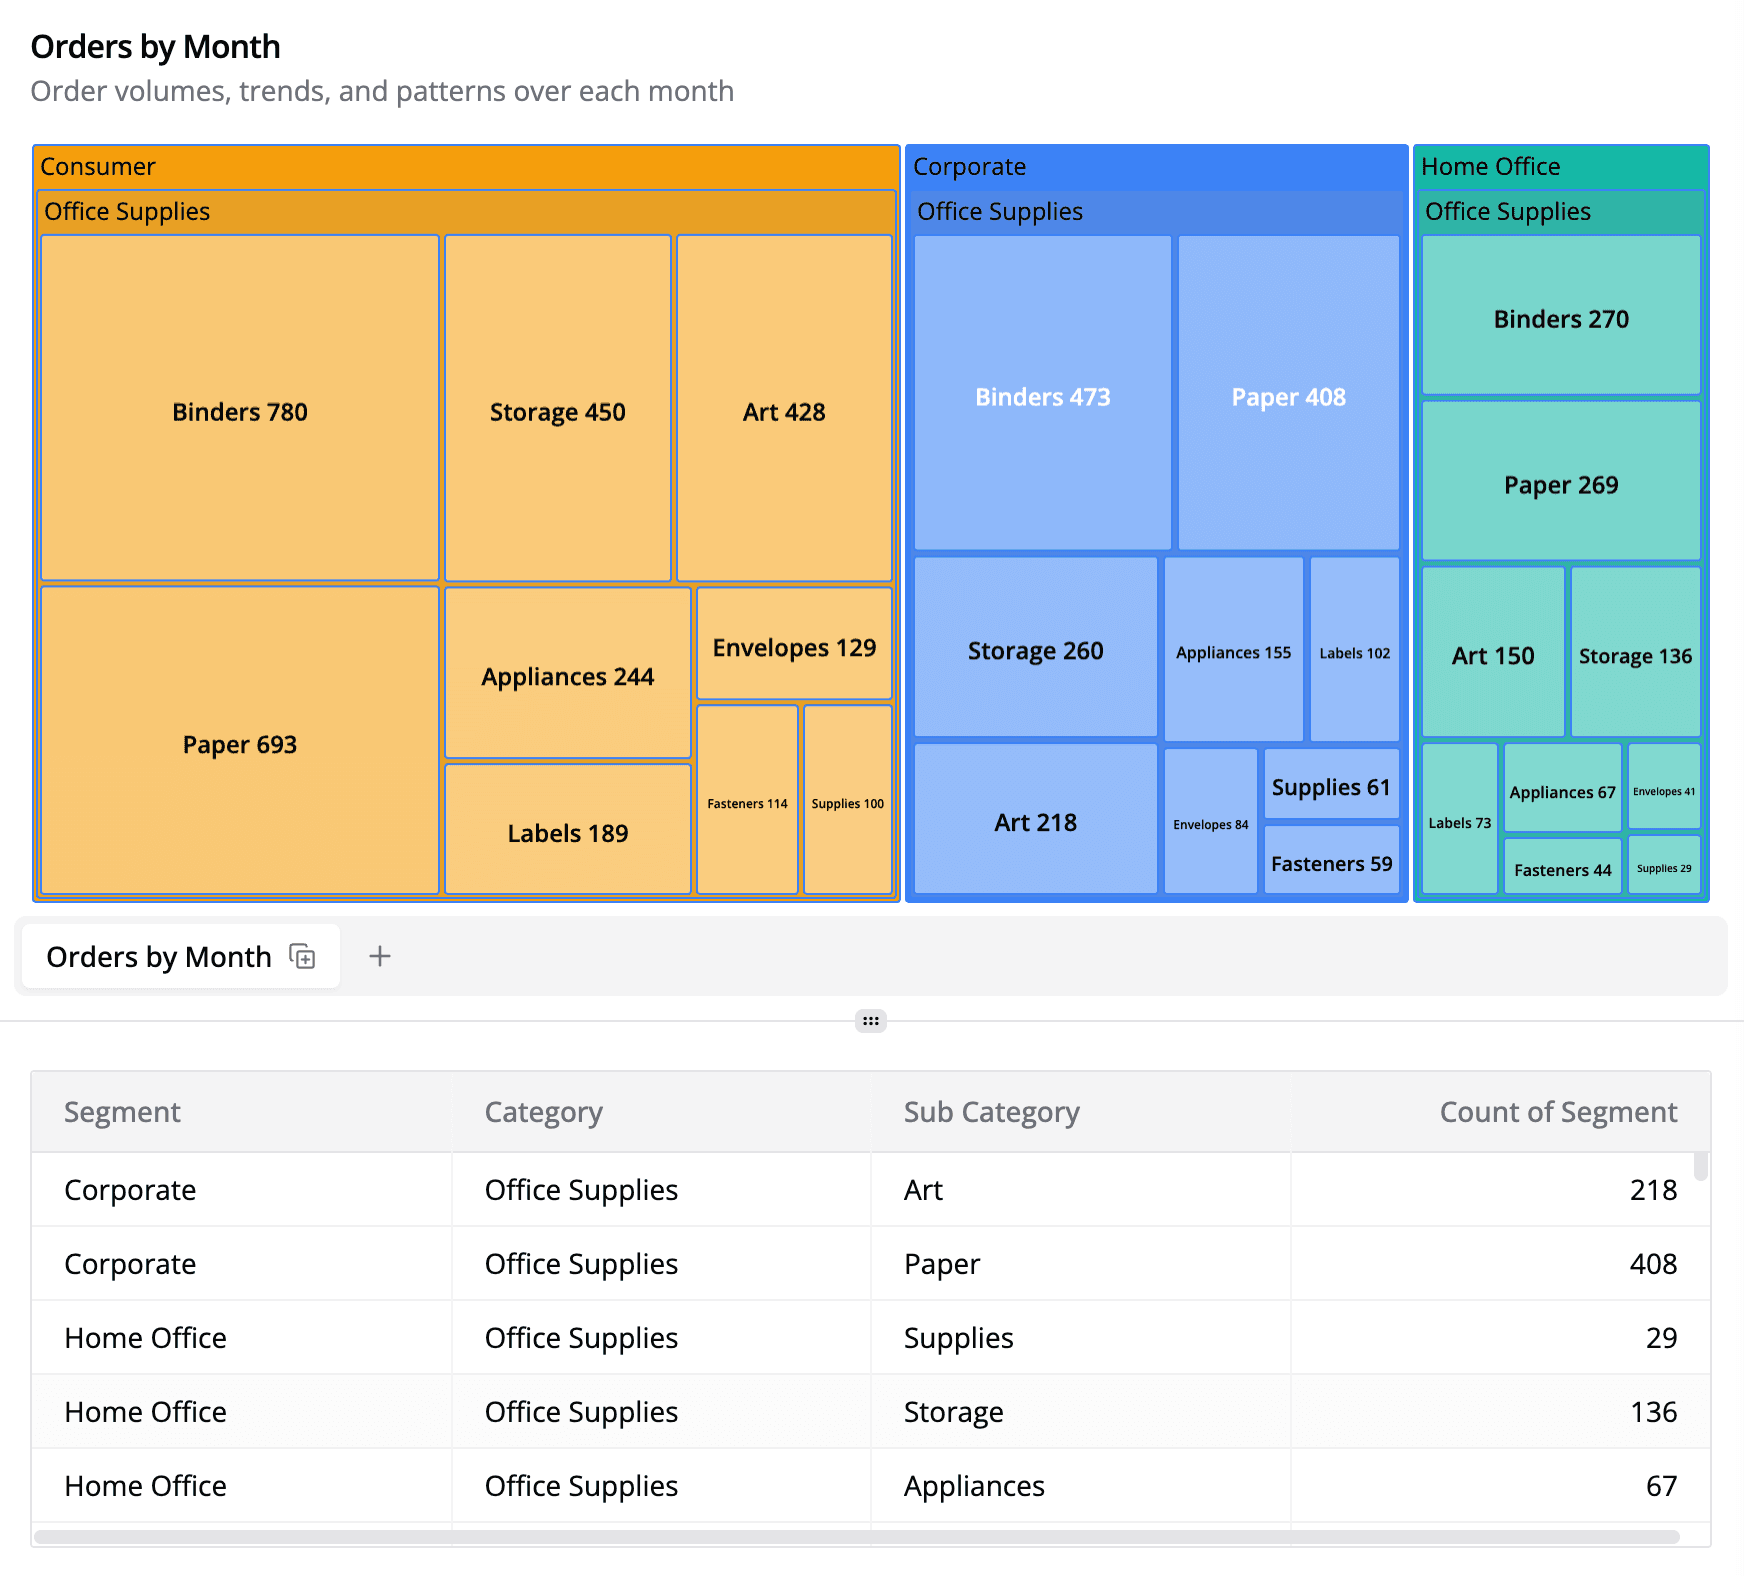
- Sort your query so large categories appear first when exported to tables—treemaps already show size visually, but sorted tables help the underlying data consumers.
- Use the “category color” mode when you want to compare siblings at the same level; use branch shading when you want the saturation to reinforce the relative contribution within each group.
Treemaps give you a compact way to show “whole vs. part” relationships without switching to multiple charts.