Charts
Tornado Chart
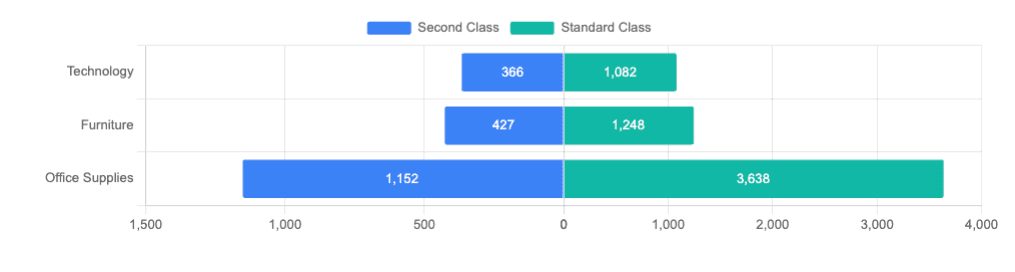
Learn how to create a tornado chart in Semaphor
If you want to visualize two cohors side by side for a set of categories, you can create a tornado chart using the following query structure.
- The first column (categorical) is mapped to the dimension.
- The second column (categorical) is mapped to the cohort.
- The third column (numerical) is mapped to the metric.
SELECT category, -- dimension field
ship_mode,  -- cohort field
COUNT(*) as count -- metric
FROM sales_data
WHERE ship_mode in ('Standard Class', 'Second Class') -- condition to select two cohorts
GROUP BY category, ship_mode
ORDER BY count
The WHERE clause in the above query narrows the values of ship_mode column into two cohorts - Stadnard Class and Second Class.
| Category        | Ship Mode      | Count |
| --------------- | -------------- | ----- |
| Technology      | Second Class   | 366   |
| Furniture       | Second Class   | 427   |
| Technology      | Standard Class | 1082  |
| Office Supplies | Second Class   | 1152  |
| Furniture       | Standard Class | 1248  |
| Office Supplies | Standard Class | 3638  |