Charts
Pie / Donut / Polar Chart
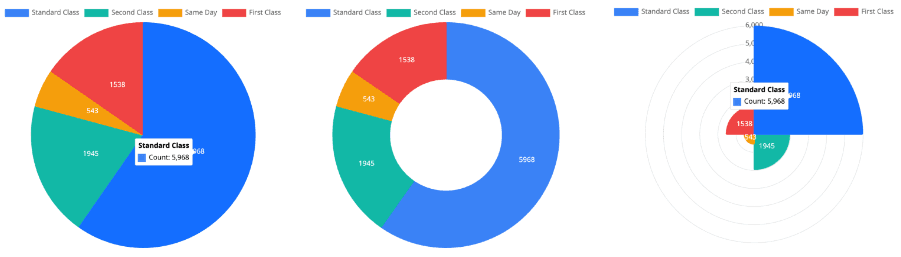
Learn how to create a pie and donut chart in Semaphor
You can create a pie chart, donut chart, or polar chart using the following SQL syntax.
- The first column (categorical) is mapped to the label.
- The second column (numerical) is mapped to the measure.
SELECT ship_mode, -- label
COUNT(*) -- measure
FROM sales_data
GROUP BY ship_mode ORDER BY ship_mode
DESC LIMIT 100| Ship Mode | Count |
| -------------- | ----- |
| Standard Class | 5968 |
| Second Class | 1945 |
| Same Day | 543 |
| First Class | 1538 |