Self-Service Analytics
Learn how to enable self-service analytics for your users
Overview
Self-service analytics empowers your customers to explore data and generate insights independently, reducing the burden on your analytics team while increasing customer satisfaction.
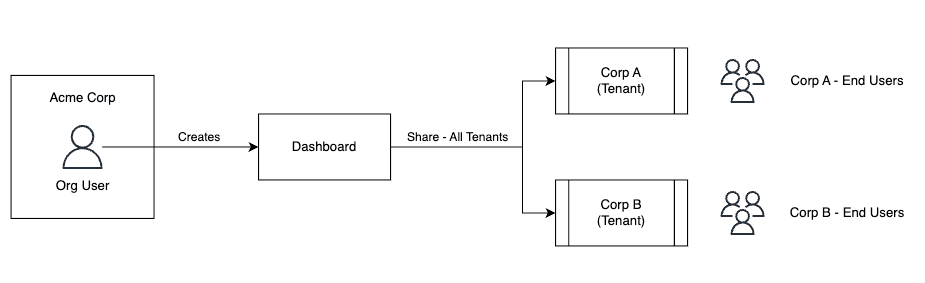
Let's explore how to implement this through the lens of Acme Corp, a shipping and logistics provider. Acme Corp wants to give their enterprise customers like Corp A and Corp B the ability to analyze their shipping data, track performance metrics, and build custom dashboards.
Before diving into implementation, let's examine the key scenarios Acme Corp needs to support:
-
Prebuilt Insights
Provide a collection of pre-built dashboards containing frequently needed insights. Users can interact with these dashboards and use AI assistant to rapidly discover insights. -
Custom Analytics
Enable data-savvy users at Corp A and Corp B to create and customize insights by modifying existing dashboards or building new ones from scratch. Their users can leverage approved datasets from Acme Corp to build insights tailored to their needs and share them with their peers.
To support both scenarios, Semaphor provides two types of users:
- Org Users: Internal users at Acme Corp who build and manage projects.
- Tenant Users: End customers of Acme Corp (e.g., users from Corp A, Corp B).
In this guide, we'll walk through the process of setting up the project, adding datasets, creating dashboards, and finally sharing them with the Tenant Users.
Step 1: Project Setup
To get started, you (Org User) need to create a new project in the Semaphor console. A project is a container for your data connections, semantic models, and dashboards.
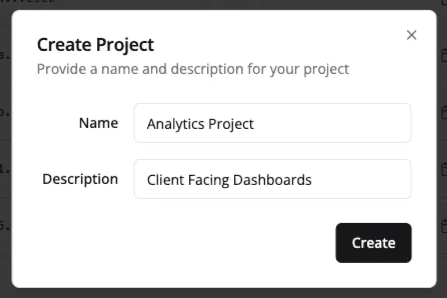
💡 After creating the project, make sure to note down your
projectIdandprojectSecret- you'll need these to authenticate API requests later.
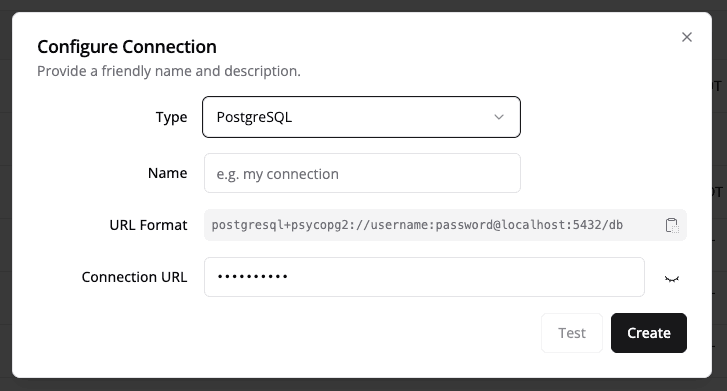
Add a Data Connection
- Go to the Connections tab.
- Click Add Connection to connect to your source data (e.g., a database or data warehouse).
- Test the connection to ensure it is working.
Once connected, Org users can begin building dashboards. However, to enable a secure and intuitive self-service experience for your end users, we recommend setting up Semantic Domains.
Step 2: Define Semantic Domains
Semantic domains allow you to group tables into logical categories, making it easier for end users to find and understand the data they need. When you're enabling self-service analytics in your product, it's important to carefully control data access and organization. Consider the following aspects:
-
Data Access Control
- Which tables and fields should end users be able to access?
- Should users see all available tables or just a curated subset?
-
Dataset Organization
- How should data be logically grouped for users (e.g., by business domain)?
- What semantic groupings make sense (sales, purchasing, reconciliation, etc.)?
Rather than exposing raw database tables, you'll want to create curated datasets with proper documentation, field descriptions, and business-friendly labels. This ensures users work with vetted, well-documented data sources rather than dealing with complex raw tables directly.
Create a Semantic Domain
- Go to the Semantic Domains tab in your project.
- Click Create Domain and give it a name (e.g., sales_analytics).
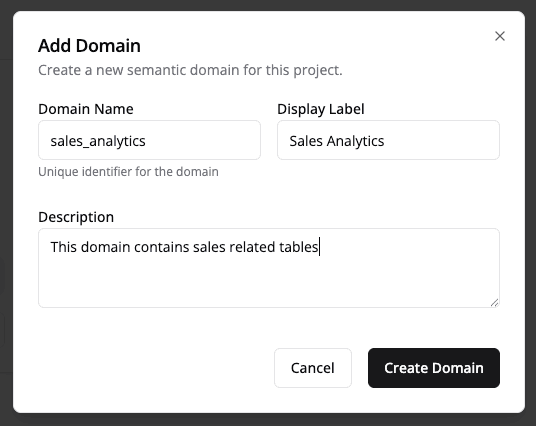
💡 After creating the domain, note down the
domainId. You’ll need this when generating access tokens for tenant users.
- Open the domain and add datasets (tables) relevant to that domain.
- Semaphor will automatically generate friendly field labels and descriptions.
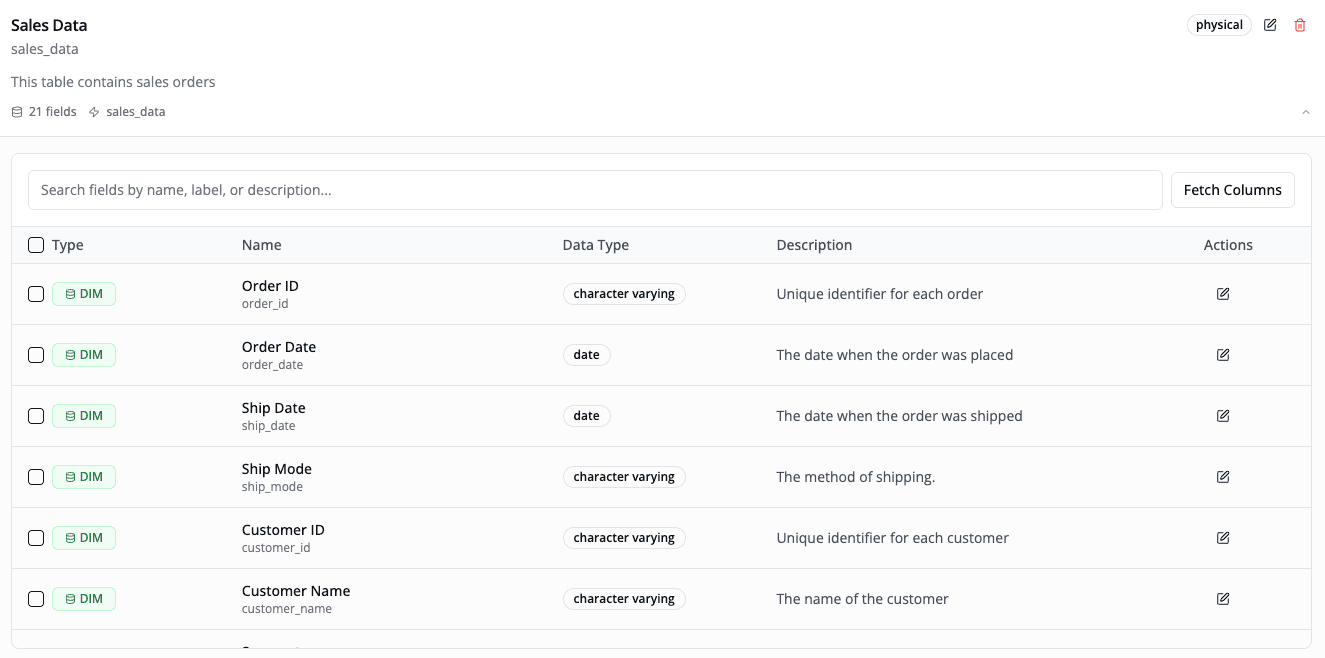
You can also remove internal or irrelevant fields, edit labels and add helpful descriptions to improve usability for end customers.
Step 3: Create a Dashboard
Now that you've defined your semantic domains, you can create dashboards for your end users.
Create a Dashboard
- Go to the Dashboards tab in your project.
- Provide a name and description — this creates a blank dashboard with one empty card.
- Click Edit, then open the card using the Eye icon in the top-right corner which will open the Explore view.
-
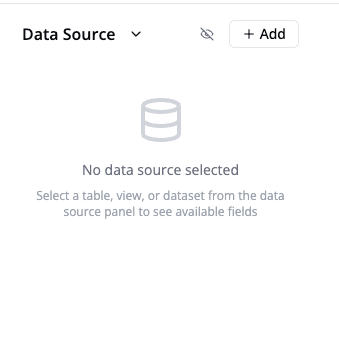
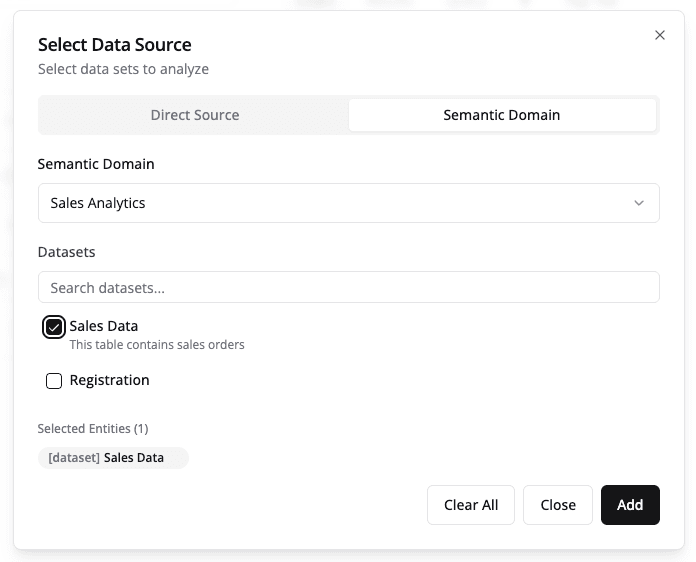
In the Explore view, click Add and select from your semantic domains.
-
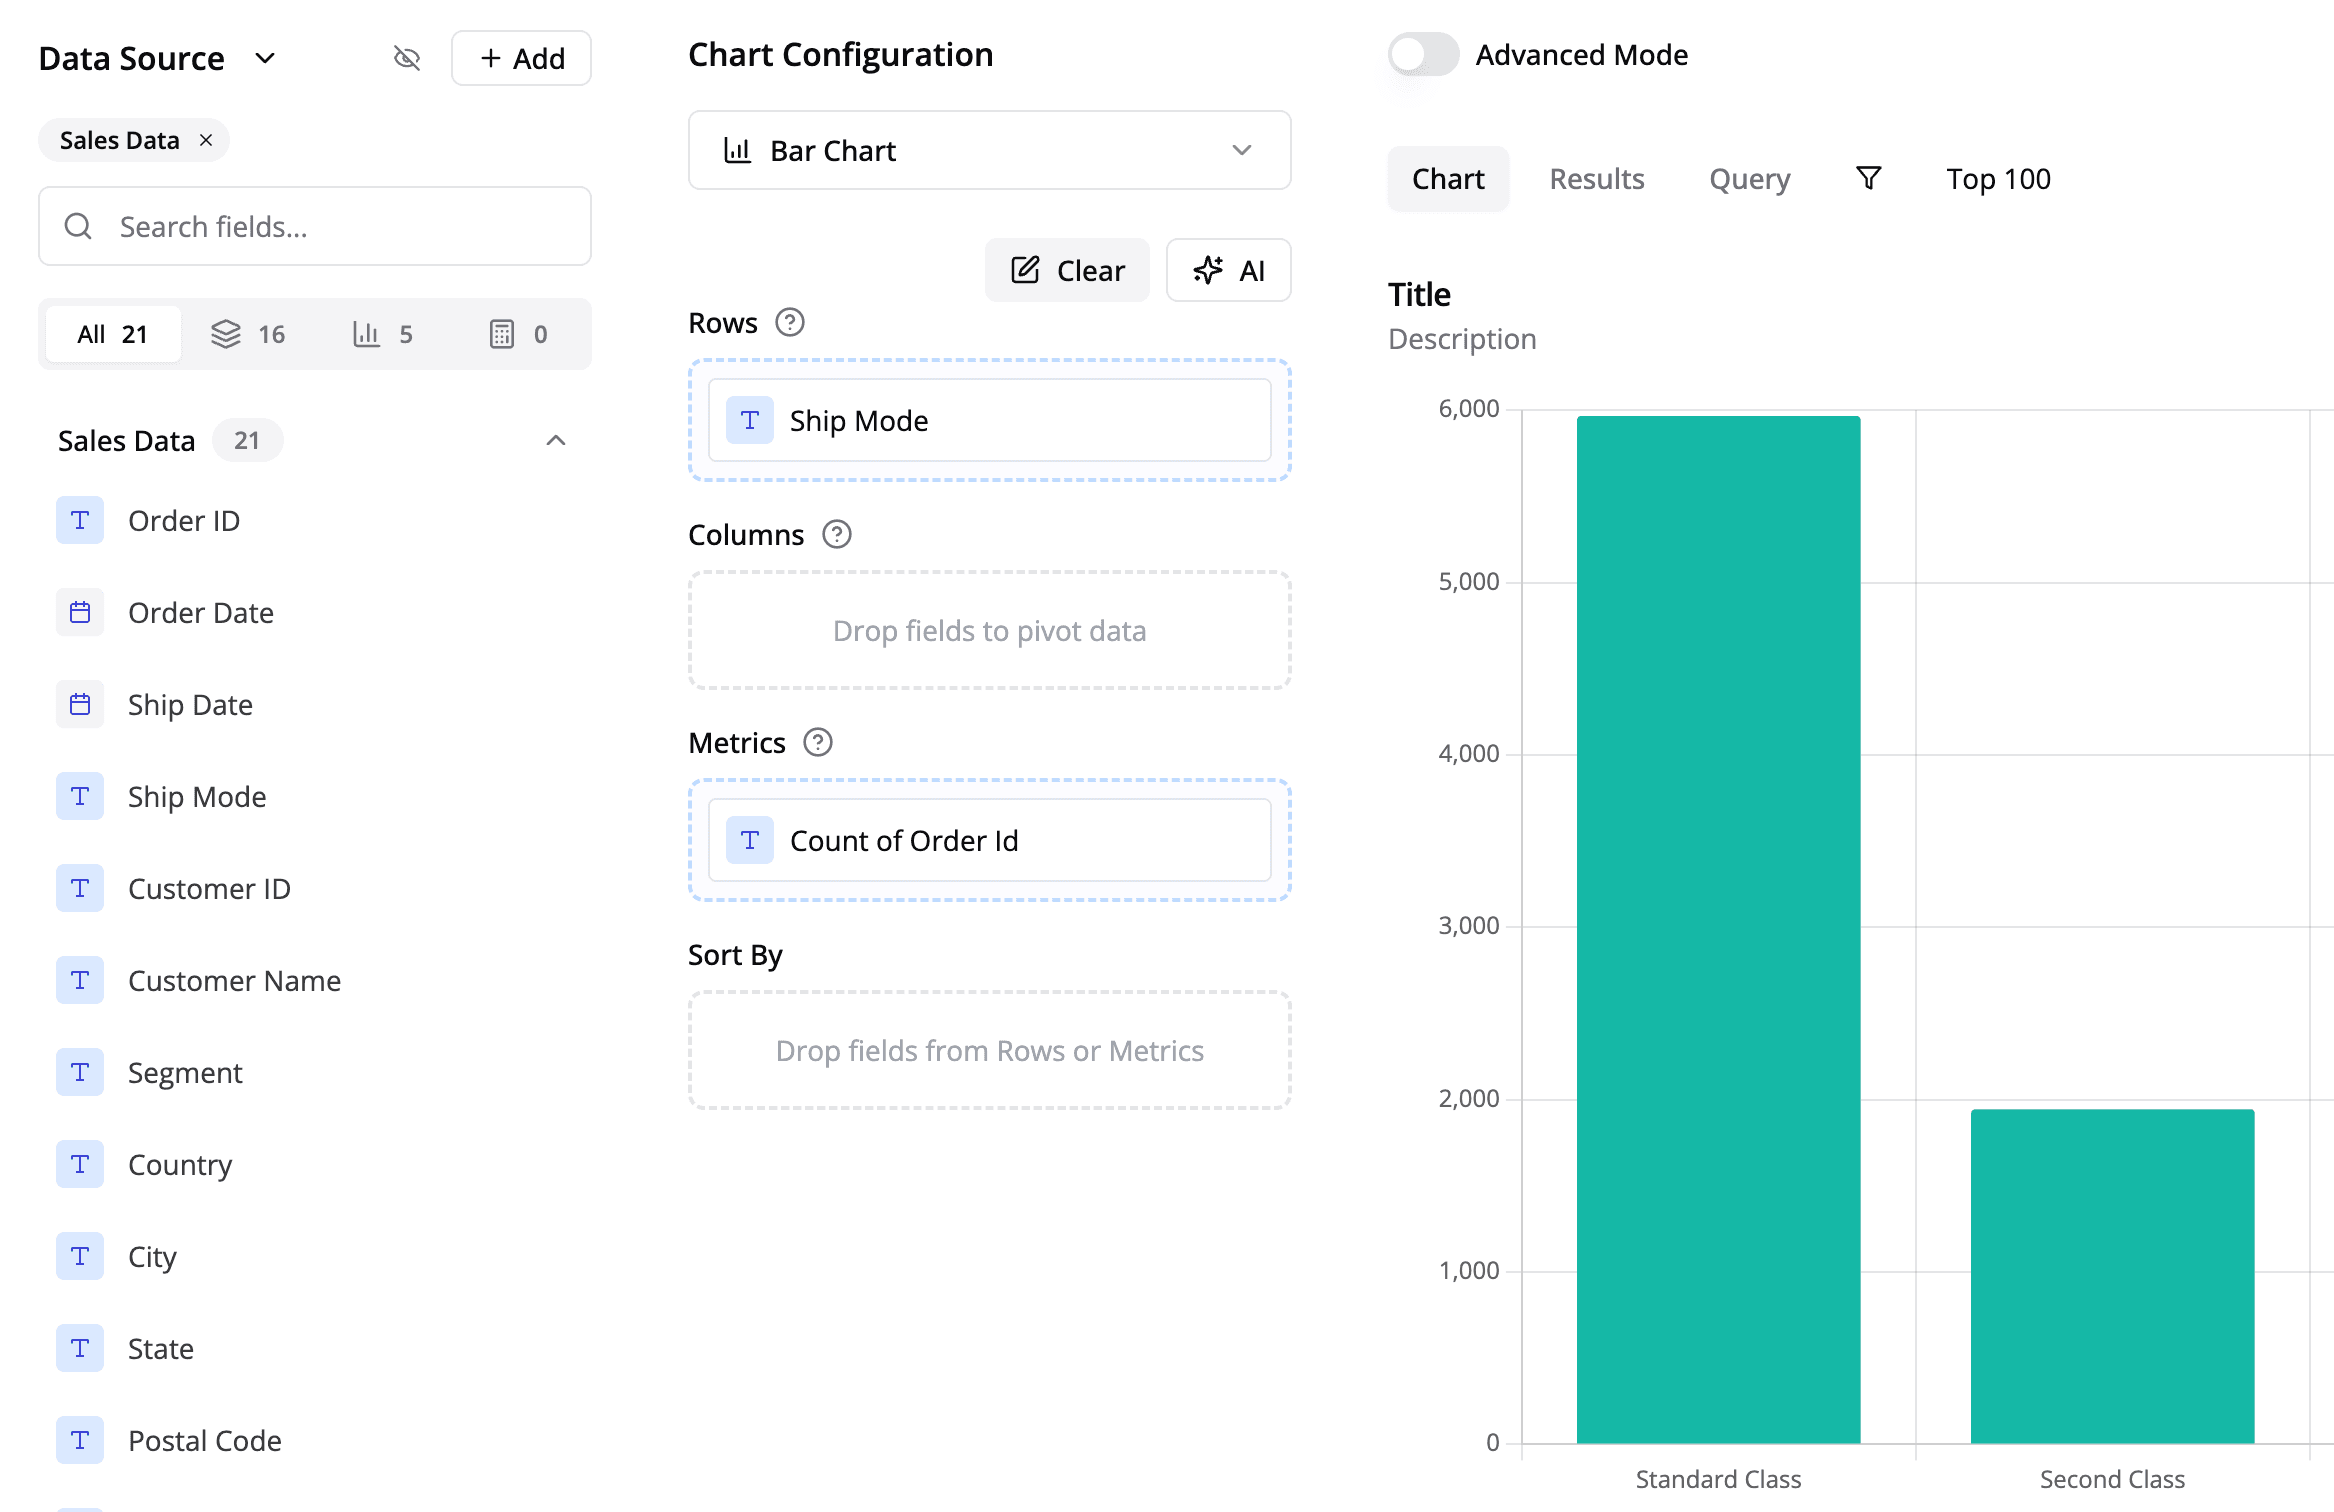
Once you've added the dataset, you can drag and drop fields to create charts and tables. Make sure to frequently save your changes.
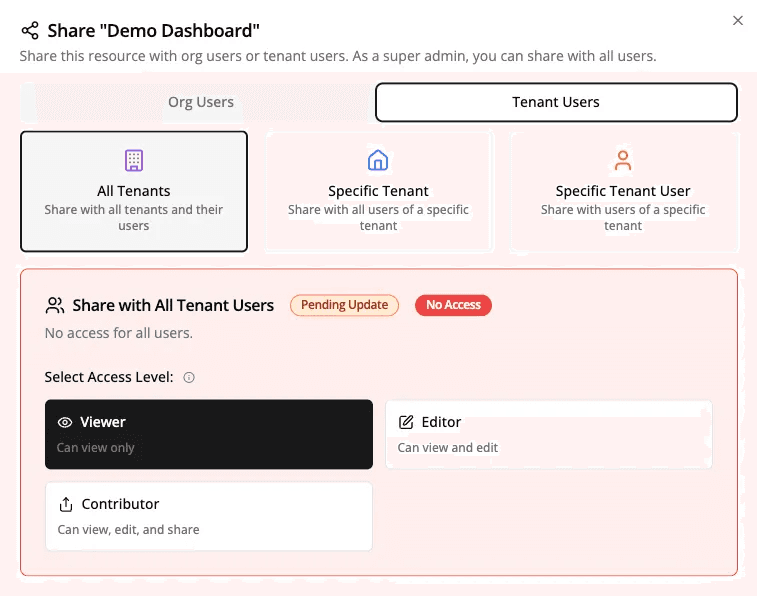
Share Dashboard with tenants
Once your dashboard is ready:
-
Click the Share button in the toolbar.
-
Choose how you'd like to share the dashboard — you can:
- Share it with all tenant users.
- Limit access to specific tenants or users.
💡 After creating the dashboard, note down the
dashboardId. You’ll need this when generating access tokens for tenant users.
This setup ensures your end customers can access relevant dashboards — or copy and customize them as needed.
Step 4: Tenant Setup
Now in our example, we have two tenants - Corp A and Corp B. This is where you would typically have your end users.
Note: Tenants and their users can also be created programmatically using the Tenants and Tenant Users API. In this guide, we'll use the Admin Panel for demonstration.
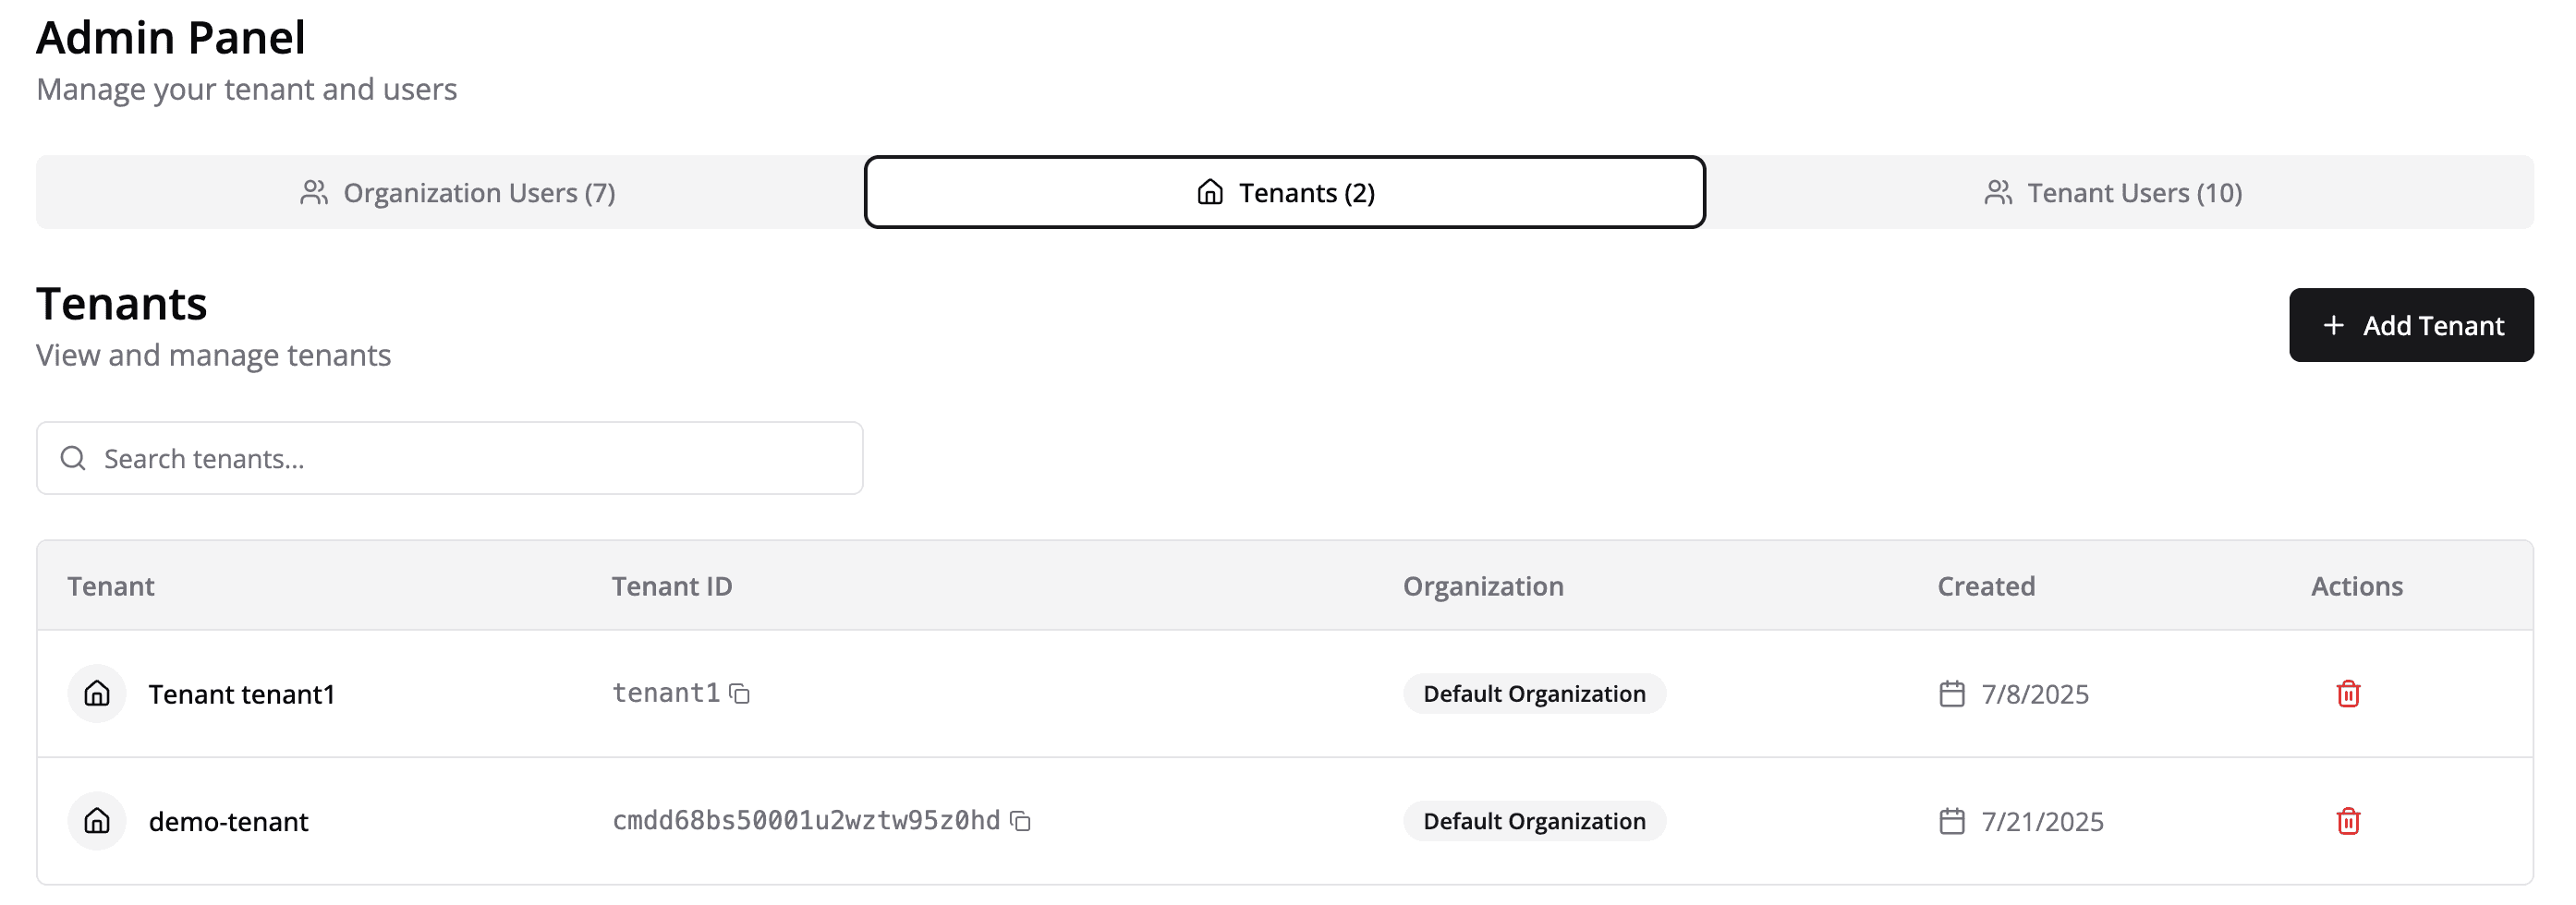
Create a Tenant
- From the Project page, click the three dots menu (⋮).
- Select Admin Panel.
- In the Admin Panel, go to the Tenants tab.
- Click Add Tenant and enter your customer’s information.
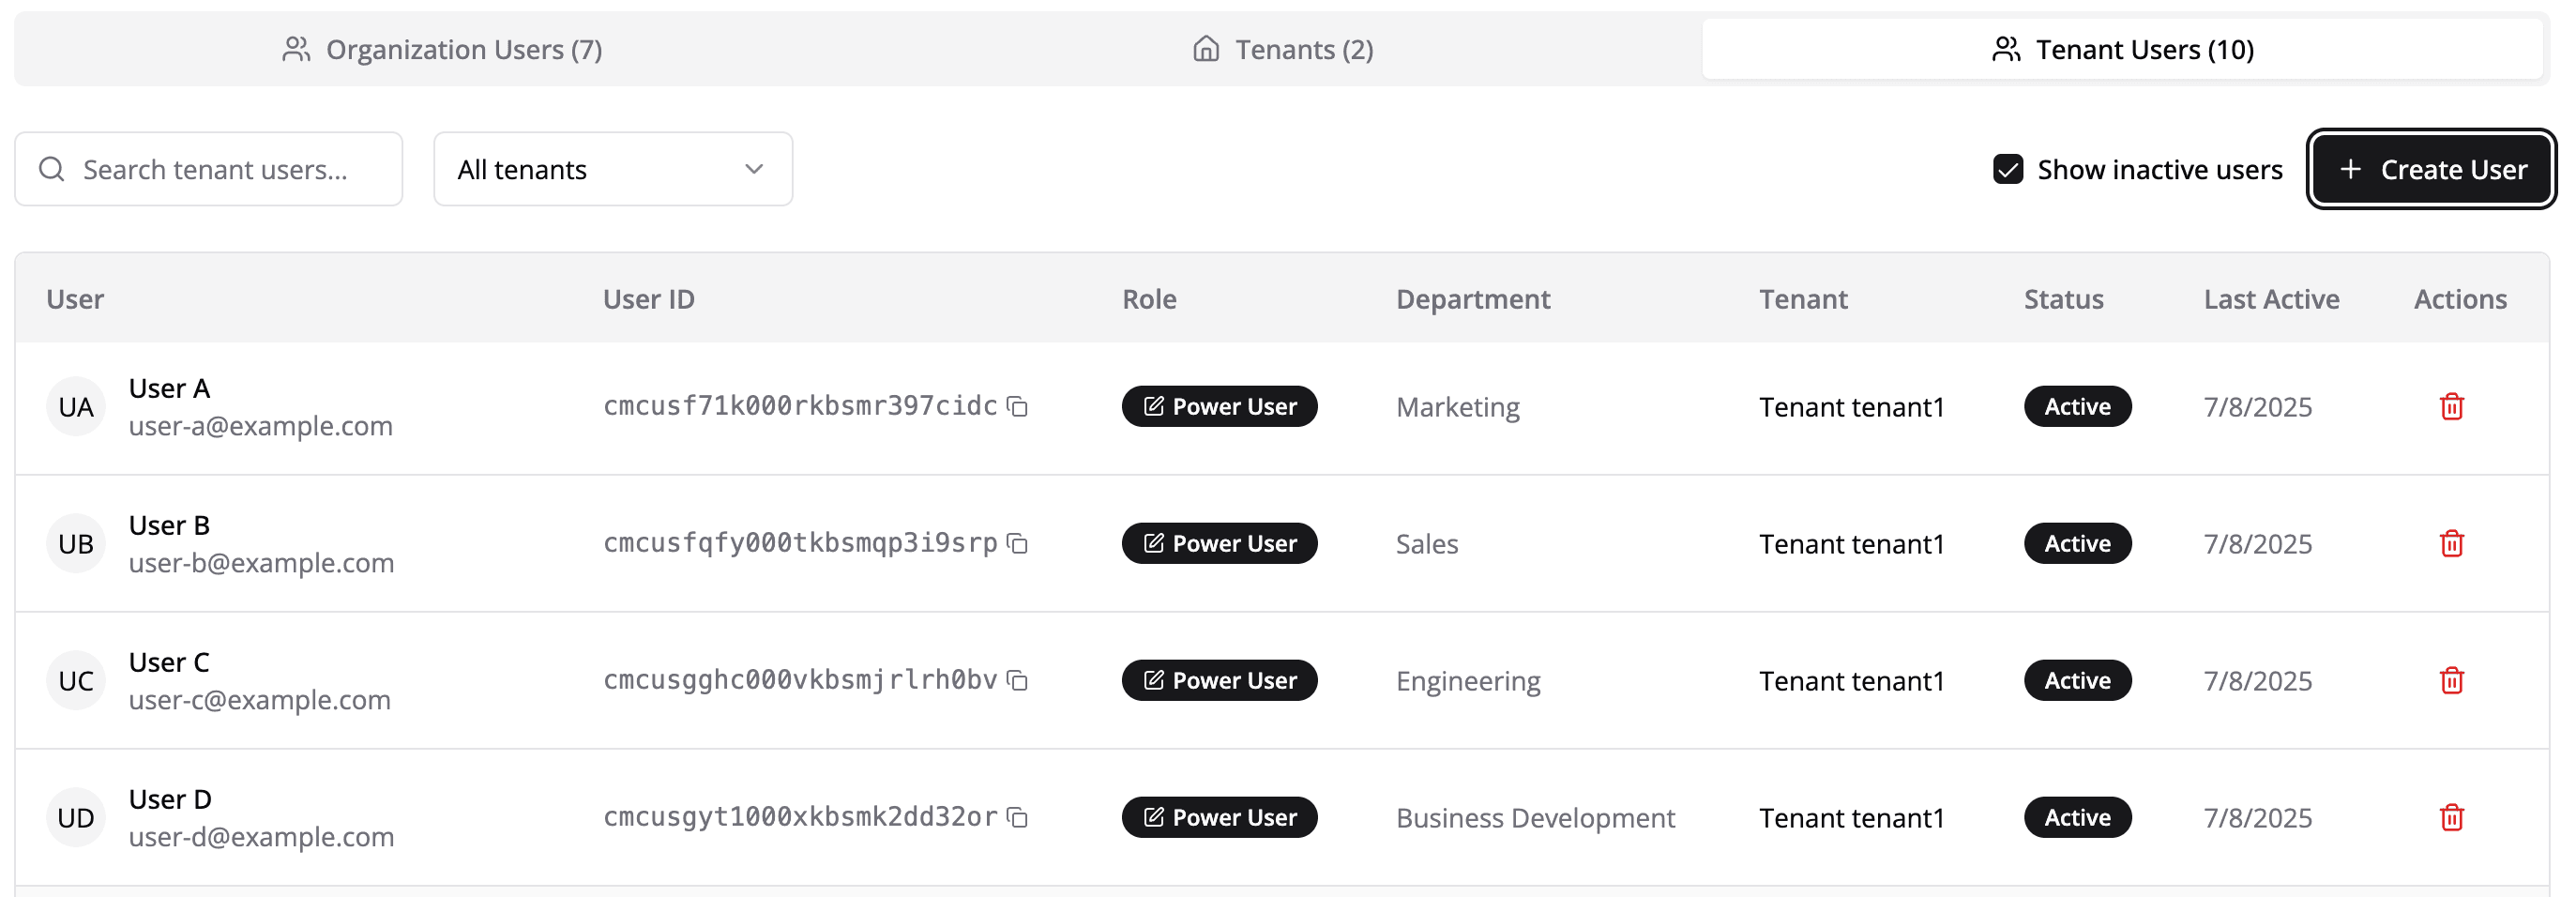
Create a Tenant User
- Go to the Users tab.
- Click Add User and enter your user’s information.
- Once created, note down the Tenant User ID — you’ll need this later during token generation.
Step 5: Generate Token
Now that everything is in place, you can generate access tokens for each tenant user to enable secure, self-service analytics within your app.
Parameters for Token Generation
- Project Credentials:
projectIdandprojectSecret. These authenticate access to the project. - Tenant User ID:
endUserId. The unique identifier for the user accessing the dashboard in your app. You can also use the combinedendUserEmailandtenantIdparameters to authenticate a user. - Semantic Domains:
semanticDomainAccess(optional). A mode-based semantic-domain scope object. - Initial Dashboard:
dashboardId(optional). The dashboard that will be loaded by default when the user logs in.
const tokenRequest = {
  projectId: 'your-project-id',
  projectSecret: 'your-project-secret',
  endUserId: 'your-tenant-user-id',
  semanticDomainAccess: {
    mode: 'include',
    domains: ['your-semantic-domain-id'],
  },
  initialDashboardId: 'your-dashboard-id',
};

// --- OR ---

const tokenRequest = {
  projectId: 'your-project-id',
  projectSecret: 'your-project-secret',
  endUserEmail: 'your-tenant-user-email',
  tenantId: 'your-tenant-id',
  semanticDomainAccess: {
    mode: 'include',
    domains: ['your-semantic-domain-id'],
  },
  initialDashboardId: 'your-dashboard-id',
};
Please refer to the Token API for more details on the parameters.
Multi-tenancy
Semaphor offers multiple approaches to handle multi-tenancy, including row-level, connection-level, and schema-level security. For this example, we'll focus on schema-level security, which provides a clean and effective way to isolate data between tenants. See the Token API and multi-tenancy documentation for details on other approaches.
In a schema-level security model, each tenant gets their own dedicated database schema:
publicschema contains shared tables and internal data for your organization- Each tenant (like
corp_aandcorp_b) gets a dedicated schema with tenant-specific tables - Table structures remain consistent across tenant schemas for easier maintenance
When generating access tokens, you can use the sls (Schema Level Security) parameter to automatically route users to their assigned schema. This ensures:
- Tenants can only access their designated schema
- Complete data isolation between tenants
- Secure and scalable multi-tenant data access
The code example below demonstrates how to implement schema-level security using the sls parameter during token generation.
Code Example (Next.js + React)
You can copy and paste the following code to generate a token and render a self-service analytics experince in your app.
Make sure you get the latest version of the semaphor package.
npm install semaphor@latestThis is the main page of your app. It will generate a token on the server for the user and render the SelfServiceAnalytics component.
export const revalidate = 0; // This is to disable the Nextjs caching behavior.
import { AuthToken } from 'semaphor';
import SelfServiceAnalytics from '@/app/components/self-service-analytics';
import { postRequest } from '@/app/server-utils';

const TOKEN_URL = 'https://semaphor.cloud/api/v1/token';

export default async function HomePage() {
  // TODO: perform your user authentication here

  const tokenRequest = {
    projectId: 'your-project-id',
    projectSecret: 'your-project-secret',
    endUserId: 'your-tenant-user-id',
    semanticDomainAccess: {
      mode: 'include',
      domains: ['your-semantic-domain-id'],
    },
    initialDashboardId: 'your-dashboard-id',
    allowEdit: true, // This will allow the user to edit the dashboard
    // sls: 'corp_a', // This will route the user to the corp_a schema
  };

  // generate token for the user
  const token = await postRequest<AuthToken>(TOKEN_URL, tokenRequest);

  return (
    <div className="flex h-screen w-full items-center justify-center">
      <SelfServiceAnalytics authToken={token} />
    </div>
  );
}
This is a server action to make a POST request to the Semaphor API.
'use server';

export async function postRequest<T>(
  url: string,
  data: Record<string, unknown> = {}
): Promise<T> {
  try {
    const response = await fetch(url, {
      method: 'POST',
      headers: {
        'Content-Type': 'application/json',
      },
      body: JSON.stringify(data),
    });

    if (!response.ok) {
      const errorResponse = await response.json();
      console.error(
        `Error: ${response.status} - ${response.statusText}`,
        errorResponse
      );
      throw new Error(`Request failed with status ${response.status}`);
    }

    const jsonResponse: T = await response.json();
    return jsonResponse;
  } catch (error) {
    console.error('Network or processing error:', error);
    throw error;
  }
}
This is a client component that renders the self-service analytics experience in your app.
'use client';
import dynamic from 'next/dynamic';
import { type AuthToken } from 'semaphor';
import 'semaphor/style.css'; // IMPORTANT! Impport the CSS file. This is the default style, you can customize it.

//Dynamic import to prevent server-side rendering.
const Surfboard = dynamic(
  () => import('semaphor').then((mod) => mod.Surfboard),
  {
    ssr: false,
  }
);

type DashboardProps = {
  authToken: AuthToken;
};

export default function SelfServiceAnalytics({ authToken }: DashboardProps) {
  return <Surfboard showAssistant showControls authToken={authToken} />;
}
Code Example (Vite + React)
You can copy and paste the following code to generate a token and render a self-service analytics experince in your app.
Make sure you get the latest version of the semaphor package.
npm install semaphor@latestimport { useEffect, useState } from 'react';
import { AuthToken, Surfboard } from 'semaphor';
import 'semaphor/style.css'; // IMPORTANT! Include the CSS file. This is the default style, you can customize it.
const PROJECT_ID = 'your-project-id';
const PROJECT_SECRET = 'your-project-secret';
const END_USER_ID = 'tenant-user-id';
const ALLOWED_SEMANTIC_DOMAINS = ['your-semantic-domain-id'];
const INITIAL_DASHBOARD = 'your-dashboard-id';
const TOKEN_URL = 'https://semaphor.cloud/api/v1/token';
function App() {
const [authToken, setAuthToken] = useState<AuthToken>();
const tokenRequest = {
projectId: PROJECT_ID,
projectSecret: PROJECT_SECRET,
endUserId: END_USER_ID,
semanticDomainAccess: {
mode: 'include',
domains: ALLOWED_SEMANTIC_DOMAINS,
},
initialDashboardId: INITIAL_DASHBOARD,
allowEdit: true, // This will allow the user to edit the dashboard
// sls: 'corp_a', // This will route the user to the corp_a schema
};
useEffect(() => {
async function fetchToken() {
try {
const response = await fetch(TOKEN_URL, {
method: 'POST',
headers: {
'Content-Type': 'application/json',
},
body: JSON.stringify(tokenRequest),
});
if (!response.ok) {
throw new Error(`HTTP error! status: ${response.status}`);
}
const token = await response.json();
if (token?.accessToken) {
setAuthToken(token);
}
} catch (error) {
console.error('There was an error!', error);
}
}
fetchToken();
}, []);
return (
<div style={{ width: '100%', height: '100vh' }}>
<Surfboard showAssistant showControls authToken={authToken} />
</div>
);
}
export default App;Code Example (I-frame + React)
This is a sample code to embed the self-service analytics experience in your app using an i-frame.
Do not expose projectSecret in client-side code in production. Use a backend
service to fetch the token securely.
import { useEffect, useState } from 'react';
const PROJECT_ID = 'your-project-id';
const PROJECT_SECRET = 'your-project-secret';
const END_USER_ID = 'tenant-user-id';
const ALLOWED_SEMANTIC_DOMAINS = ['your-semantic-domain-id'];
const INITIAL_DASHBOARD = 'your-dashboard-id';
const TOKEN_URL = 'https://semaphor.cloud/api/v1/token';
type AuthToken = {
accessToken: string;
};
function App() {
const [authToken, setAuthToken] = useState<AuthToken>();
const tokenRequest = {
projectId: PROJECT_ID,
projectSecret: PROJECT_SECRET,
endUserId: END_USER_ID,
semanticDomainAccess: {
mode: 'include',
domains: ALLOWED_SEMANTIC_DOMAINS,
},
initialDashboardId: INITIAL_DASHBOARD,
allowEdit: true, // This will allow the user to edit the dashboard
tokenExpiry: 60 * 30, // 30 minutes
// sls: 'corp_a', // This will route the user to the corp_a schema
};
useEffect(() => {
async function fetchToken() {
try {
const response = await fetch(TOKEN_URL, {
method: 'POST',
headers: {
'Content-Type': 'application/json',
},
body: JSON.stringify(tokenRequest),
});
if (!response.ok) {
throw new Error(`HTTP error! status: ${response.status}`);
}
const token = await response.json();
if (token?.accessToken) {
setAuthToken(token);
}
} catch (error) {
console.error('There was an error!', error);
}
}
fetchToken();
}, []);
const url = `https://semaphor.cloud/embed/${authToken?.accessToken}?showAssistant=true&showControls=true¤tTheme=light`;
if (!authToken) {
return <div>Loading...</div>;
}
return (
<div style={{ width: '100%', height: '100vh' }}>
<iframe src={url} width="100%" height="100%" />
</div>
);
}
export default App;