User Guide
Learn how to use semantic domains to build dashboards and explore data
Using Semantic Domains in Dashboards
Once your administrator has set up a semantic domain with datasets and relationships, you can use it to explore data across multiple datasets without writing any SQL or manually configuring joins.
Quick Start
Using semantic domains is simple:
- Create a card → Select "Semantic Domain" as data source
- Drag fields → Select fields from any dataset (green = can join, gray = can't join)
- Query runs automatically → Semaphor joins datasets and displays results
- Review joins → Check Auto-Resolved Joins panel to see how data was joined
Key benefit: No manual join configuration required!
Now let's walk through each step in detail.
Step 1: Create a Card with Semantic Domain
- Open a dashboard or create a new one
- Click "Add Card" to create a new visualization
- In the Data Source dropdown, select "Semantic Domain"
- Choose your domain from the list of available domains
- Click "Continue" or "Next"
Step 2: Understanding the Field Explorer
After selecting a semantic domain, you'll see the Fields List on the left side of the Visual tab. This shows all available fields organized by dataset.
Field Explorer Features:
- Search bar: Filter fields by name, dataset, or data type
- Category tabs: View all fields, dimensions only, or metrics only
- Dataset grouping: Fields are grouped by their source dataset
- Visual indicators: Color-coded badges show field draggability
Domain-Level Calculated Fields
Your administrator may have added calculated metrics and calculated dimensions to the domain. These appear in the field list with a Domain badge.
You can use domain-level calculated fields just like any other field - drag them into your visualizations, use them in filters, and combine them with other fields. However, these fields are managed by administrators, so you cannot edit or delete them.
Physical and Virtual Datasets
Some datasets are backed by tables (physical) and others by SQL (virtual). They behave identically in the field list -- relationships, auto-joins, and filters all work the same way.
Step 3: Understanding Field States
Fields show visual indicators based on whether they can be joined to your current selection:
| State | Visual | Meaning |
|---|---|---|
| Base | Blue | Your starting dataset |
| Draggable | Green | Can join directly (1-hop) |
| Indirect | Yellow | Multi-hop join needed (2-hop) |
| Unreachable | Gray | Cannot join |
Hover over any field to see its description, data type, and join path (if applicable).
Step 4: Selecting Fields Across Datasets
You can drag and drop fields from multiple related datasets into your chart. Semaphor automatically resolves the necessary joins.
Example Workflow: Sales by Customer Segment
- Start with your fact table: Drag
revenuefrom theordersdataset to Metrics - Add a dimension: Drag
customer_segmentfrom thecustomersdataset to Dimensions - Result: Semaphor automatically joins
orderstocustomersusing the relationship defined by your admin
What Happens Behind the Scenes:
- Semaphor detects you're using fields from
ordersandcustomers - It finds the relationship between these datasets (e.g.,
orders.customer_id = customers.id) - It automatically creates a LEFT JOIN
- The query executes with the join applied
No manual join configuration required!
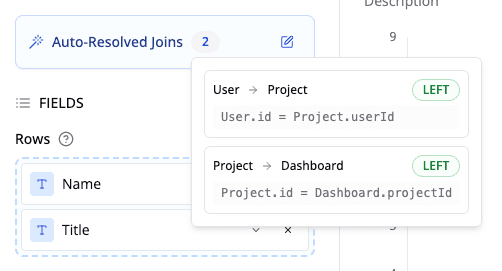
Step 5: Viewing Auto-Resolved Joins
After running a query with auto-joined datasets, you'll see the Auto-Resolved Joins panel in the Visual tab.
This collapsible panel shows:
- Number of joins resolved automatically
- Join details for each relationship:
- Source and target datasets (e.g.,
orders → customers) - Join type (INNER, LEFT, RIGHT, FULL)
- Join conditions (which fields are matched)
- Source and target datasets (e.g.,
Example:
When to review auto-joins:
- You want to understand why certain data is included/excluded
- Query results seem unexpected (check join types)
- You're learning how datasets relate to each other
- You need to verify the join logic for documentation
Understanding Multi-Hop Joins
Multi-hop joins connect datasets through intermediate datasets when no direct relationship exists.
Example: Analyzing orders by country
- Orders connects to Stores (hop 1)
- Stores connects to Countries (hop 2)
- Result: Orders → Stores → Countries
How to identify multi-hop joins:
- Yellow indicator on field badges
- Join path shown in hover tooltip
- Multiple joins listed in Auto-Resolved Joins panel
When to use:
- Geographic hierarchies (stores → countries)
- Organizational structures (employees → managers → departments)
- Time rollups (daily → monthly → quarterly)
When to be cautious:
- May be slower on large datasets
- Check row counts match expectations
Common User Scenarios
Scenario 1: Simple Cross-Dataset Analysis (1-Hop)
Goal: Analyze total order revenue by customer segment
Steps:
- Select semantic domain:
Sales Analytics - Drag
revenuefromorders→ Metrics (establishes base dataset) - Drag
customer_segmentfromcustomers→ Dimensions (shows green - can join) - Click "Run Query"
Result:
- Semaphor auto-joins
orderstocustomers - Chart shows revenue grouped by customer segment
- Auto-join panel shows:
orders → customers [LEFT JOIN]
Scenario 2: Multi-Hop Join (2-Hop)
Goal: Show order revenue by country name
Steps:
- Select semantic domain:
Sales Analytics - Drag
revenuefromorders→ Metrics - Drag
country_namefromcountries→ Dimensions (shows yellow - indirect join) - Hover to see join path:
orders → stores → countries - Click "Run Query"
Result:
- Semaphor creates a 2-hop join through
stores - Auto-join panel shows both joins:
- Join 1:
orders → stores [LEFT JOIN] - Join 2:
stores → countries [LEFT JOIN]
- Join 1:
- Chart displays revenue by country
Using Metric Transforms with Domain Fields
You can apply metric transforms (running totals, moving averages, period-over-period deltas, percent of total) to any numeric metric from a semantic domain.
When configuring a transform on a domain metric:
- Order By auto-detects the first date field from your group-by columns
- Reset By (partitioning) auto-populates with all group-by fields except the order-by field
- Transforms work across auto-joined datasets -- you can apply a running total to a metric from one dataset while ordering by a date field from a related dataset
Transforms and Calculated Fields
Metric transforms can be applied to both regular domain metrics and domain-level calculated fields. For example, you can create a calculated metric for "Profit Margin" in the domain and then apply a moving average transform to track how it trends over time.
Next Steps
Now that you understand how to use semantic domains:
- Explore your data: Start building dashboards with auto-join enabled
- Leverage relationships: Use multi-hop joins to answer complex questions
- Review auto-joins: Check the Auto-Resolved Joins panel to understand join logic
- Ask for help: Request new relationships from your admin when needed
- Share insights: Document your analyses and share with your team
If you encounter issues, check the Troubleshooting guide for solutions to common problems.