Admin Setup Guide
Complete guide for administrators to create and configure semantic domains
Navigating to Domains
- Log in to Semaphor
- Select your project from the project list
- Click on "Domains" tab in the top navigation
Creating a Domain
Step 1: Create a New Domain
- On the Domains page, click the "Create Domain" button
- Fill in the domain details:
- Name: A unique identifier (e.g.,
sales_analytics) - Label: User-friendly display name (e.g.,
Sales Analytics) - Description: Brief explanation of what this domain covers
- Connection: Select the data connection this domain uses
- Name: A unique identifier (e.g.,
- Click "Create" to save your domain
Quick Setup Summary
Before diving into the details, here's the complete workflow at a glance:
- Create Domain → Name it and select a connection
- Add Datasets → Select tables, let AI generate labels (30-60s per dataset)
- Discover Relationships → Run AI discovery, accept suggestions (1-2 minutes)
- Save & Test → Save domain, test in a dashboard card
Total time: 5-10 minutes for a typical domain with 4-5 datasets
The AI does most of the work! Semaphor automatically generates field labels, descriptions, and discovers relationships between your datasets. Your main job is reviewing and accepting suggestions.
Now let's walk through each step in detail.
Step 2: Open the Domain Editor
After creating your domain, you'll be taken to the Domain Editor, which has four tabs:
- Datasets: Add and configure your data sources
- Relationships: Define how datasets connect
- Code Editor: View and edit the domain as YAML/JSON
- Preview: Test your domain configuration
Adding Datasets
After creating your domain, you'll add the datasets (tables) you want users to explore.
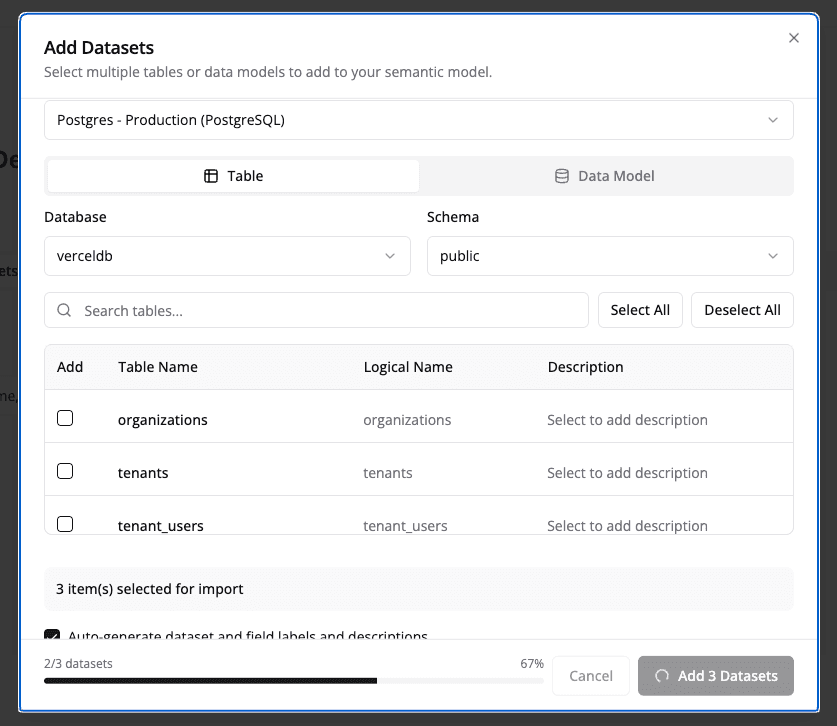
Step 1: Select Your Datasets
- In the Domain Editor, ensure you're on the Datasets tab
- Click the "Add Dataset" button
- Choose one of three modes: Tables (default, multi-select physical tables), Data Model (reference an existing data model), or SQL Dataset (author a SQL-backed virtual dataset). See Virtual Datasets for the SQL Dataset walkthrough.
- Select the tables or views you want to include from your database
- Click "Add" to add each dataset
AI-Powered Labels: After adding datasets, Semaphor automatically generates user-friendly labels, field names, and descriptions using AI. This process takes a few moments but saves you from manually configuring each field.
Step 2: Wait for AI Processing
After you add datasets and click Save, Semaphor's AI automatically:
- Generates customer-facing labels for table names (e.g.,
orders_tbl→ "Orders") - Creates readable field names (e.g.,
cust_id→ "Customer ID") - Adds helpful descriptions for fields
- Classifies fields as dimensions (groupable) or measures (aggregatable)
- Suggests appropriate aggregation functions (SUM, COUNT, AVG)
Note: This AI operation typically takes 30-60 seconds per dataset. You'll see a loading indicator while processing.
Step 3: Review AI-Generated Fields (Optional)
After AI processing completes, you can review and adjust the generated labels:
- Click the "Edit" button (pencil icon) next to a dataset
- Review the AI-generated field labels and descriptions
- Make adjustments if needed (most users find the AI labels work well as-is)
- Hide any fields that shouldn't be visible to end users
Advanced: You can also create virtual datasets using custom SQL queries. See the Advanced Configuration section below.
That's all you need to get your datasets ready! The AI handles the labeling and classification automatically. Next, you'll define how these datasets relate to each other.
Creating Relationships
Relationships define how datasets connect to each other, enabling automatic joins when users explore data across multiple datasets.
Recommended Workflow: Use AI Discovery to automatically identify relationships. Most users find they don't need to manually define any relationships after using AI discovery.
Using AI-Powered Relationship Discovery
Semaphor can automatically discover potential relationships between your datasets using AI analysis of field names, data types, and semantic patterns. This is the fastest way to set up your domain.
The relationship discovery process typically takes 1-2 minutes to complete.
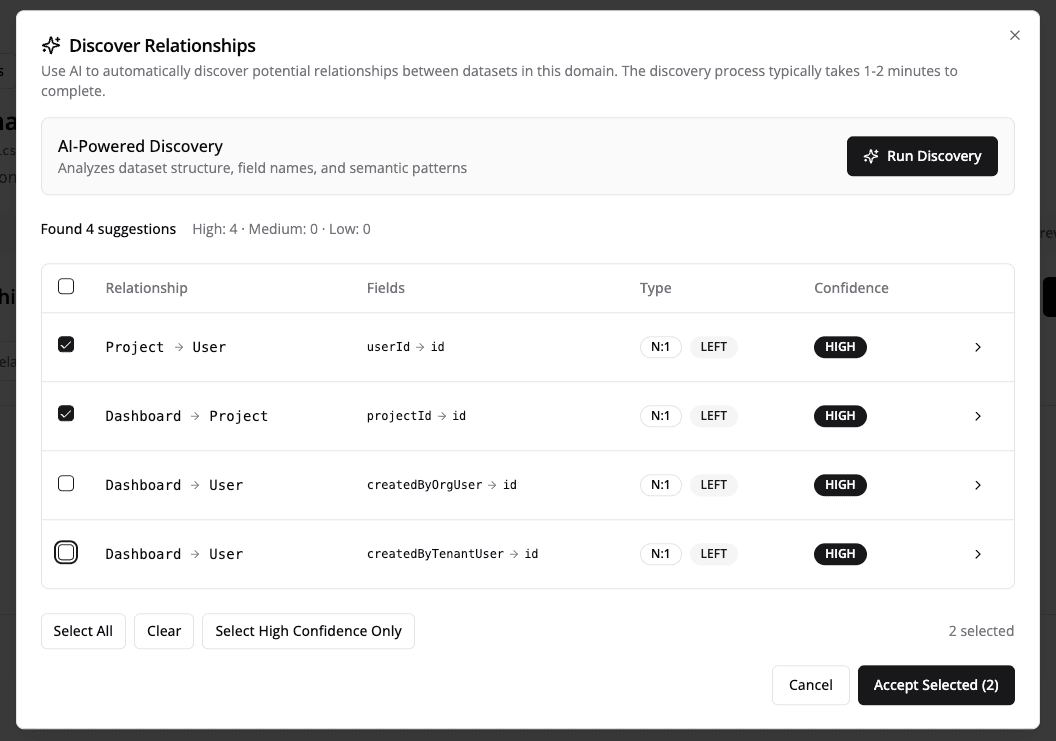
The entire process takes just a few steps:
- Click "Discover Relationships" in the Relationships tab
- Click "Run Discovery" and wait 1-2 minutes while AI analyzes your datasets
- Review the suggestions - each shows confidence (High/Medium/Low) and rationale
- Select relationships to add - use "Select High Confidence Only" or review each one
- Click "Accept Selected" - done!
What the AI analyzes:
- Field names (e.g.,
customer_idlikely joins tocustomers.id) - Data types (matching types for join keys)
- Semantic patterns (fact tables to dimension tables)
- Table structures (primary/foreign key patterns)
What you'll see in suggestions:
- Source → Target: Which datasets connect (e.g.,
orders → customers) - Join Fields: Which fields match (e.g.,
orders.customer_id = customers.id) - Confidence: High, Medium, or Low
- Rationale: Why the AI thinks this relationship exists
- Cardinality: One-to-one, one-to-many, etc.
Tip: Start by accepting only High Confidence relationships. You can always run discovery again or manually add relationships later.
That's it! After accepting relationships, your domain is ready for users to query. The relationships enable automatic joins when users select fields from multiple datasets.
Advanced: Manual Relationship Management
Note: Most users don't need to manually create relationships after using AI Discovery. This section is for advanced use cases.
If you need to manually add or edit a relationship:
- In the Relationships tab, click "Add Relationship"
- Fill in the relationship details:
- Name: Identifier (e.g.,
orders_to_customers) - Source/Target Datasets: Which datasets to connect
- Join Fields: Which fields to match
- Cardinality: One-to-one, one-to-many, etc.
- Join Type: INNER, LEFT, RIGHT, or FULL
- Name: Identifier (e.g.,
- Enable Auto-Join to allow automatic join resolution
- Click "Save"
When to manually add relationships:
- AI didn't detect a relationship you know exists
- You need to specify a specific join type (e.g., INNER vs LEFT)
- You're working with non-standard naming conventions
- You need composite key relationships (multiple join fields)
Testing Your Domain
Step 1: Save Your Changes
After configuring datasets and relationships:
- Click the "Save" button in the top-right corner
- Wait for the confirmation message
- Your changes are now persisted
Step 2: Preview the Domain
- Click the "Preview" tab in the Domain Editor
- You'll see a summary of your domain:
- All datasets with their field counts
- All relationships with source/target info
- Validation warnings (if any)
Step 3: Test in a Dashboard
- Create a new dashboard or open an existing one
- Add a new card
- Select "Semantic Domain" as the data source
- Choose your domain from the dropdown
- Try selecting fields from different datasets
- If relationships are configured correctly, joins happen automatically
- If fields from unrelated datasets are selected, you'll see an error
Advanced Configuration
Advanced Dataset Configuration
Creating Virtual Datasets
Virtual datasets are SQL-backed semantic datasets stored directly in your domain template. Use them for pre-aggregated data, reshaping, or complex joins encoded once and reused across dashboards.
In Add Dataset, switch to the SQL Dataset mode (alongside Tables and Data Model) to pick an owning connection, write SQL in a Monaco editor, run Preview Columns to discover fields, and save. Both subqueries and CTEs are supported.
See Virtual Datasets for the full walkthrough, including SQL examples, editing flow, maintenance actions (Preview Columns, Fetch New Columns, Sync Data Types), and how to handle drift.
Manual Field Configuration
If you need to manually adjust field properties beyond what AI generates:
- Click "Edit" on a dataset
- For each field, you can modify:
- Label: User-friendly display name
- Description: Help text explaining the field
- Data Type: String, Number, Date, DateTime, Boolean
- Field Type: Dimension (groupable) or Measure (aggregatable)
- Aggregate Function: SUM, AVG, COUNT, MIN, MAX for measures
- Visibility: Show/hide from users (eye icon)
Best practices:
- Use clear labels: "Order Date" instead of "ord_dt"
- Add descriptions to help users understand fields
- Mark dimensions correctly for proper grouping
- Set default aggregations for measures
Domain Template Schema
Every semantic domain is stored as a template that defines datasets, relationships, and calculated fields. Understanding the schema helps with advanced configuration, version control, and CI/CD pipelines.
For a step-by-step tutorial on writing templates by hand, including how they translate into SQL queries, see the Template Guide.
Template Structure
schemaVersion: "2.0"
datasets: [...]              # Array of dataset definitions
relationships: [...]         # Array of relationship definitions
calculatedMetrics: {...}     # Record<name, definition>
calculatedDimensions: {...}  # Record<name, definition>
Dataset Schema
Each dataset in the datasets array has this structure:
| Field | Type | Required | Description |
|---|---|---|---|
name | string | Yes | Unique identifier for the dataset |
label | string | Yes | User-friendly display name |
description | string | No | Help text for users |
type | physical | virtual | Yes | Physical table/view or custom SQL |
connectionId | string | Yes | ID of the data connection |
connectionType | string | Yes | Database type (PostgreSQL, MySQL, etc.) |
schema | string | No | Database schema name |
table | string | No | Table name (for physical datasets) |
sql | string | No | Custom SQL query (for virtual datasets) |
fields | object | Yes | Field definitions (see below) |
primaryKey | string[] | No | Primary key columns |
Fields Object:
fields:
  identifiers:    # Primary/foreign key fields
    - name: id
      label: "Order ID"
      dataType: number
      type: primary
  dimensions:     # Groupable fields
    - name: order_date
      label: "Order Date"
      dataType: date
      granularity: day
  metrics:        # Aggregatable fields
    - name: amount
      label: "Amount"
      dataType: number
      sourceField: amount
Relationship Schema
Each relationship in the relationships array:
| Field | Type | Required | Description |
|---|---|---|---|
name | string | Yes | Unique identifier |
sourceDataset | string | Yes | Name of source dataset |
sourceFields | string[] | Yes | Join columns in source |
targetDataset | string | Yes | Name of target dataset |
targetFields | string[] | Yes | Join columns in target |
cardinality | enum | No | one_to_one, one_to_many, many_to_one, many_to_many |
defaultJoinType | enum | Yes | INNER, LEFT, RIGHT, FULL |
isAutoJoin | boolean | Yes | Enable automatic join resolution |
discoveredBy | enum | Yes | user, auto, fk_constraint, ai |
isActive | boolean | Yes | Whether the relationship is active |
Calculated Metric Schema
Calculated metrics are stored in calculatedMetrics as a record (name → definition):
calculatedMetrics:
  profit_margin:
    label: "Profit Margin"
    description: "Profit as percentage of revenue"
    expression: "({revenue} - {cost}) / NULLIF({revenue}, 0)"
    inputs:
      revenue:
        dataset: orders
        field: amount
        aggregate: SUM
      cost:
        dataset: orders
        field: cost
        aggregate: SUM
    metricType: derived
    format:
      type: percentage
      decimals: 2
    tags:
      - finance
- kpi| Field | Type | Required | Description |
|---|---|---|---|
label | string | Yes | Display name |
description | string | No | Help text |
expression | string | Yes | Calculation formula with {input} tokens |
inputs | object | Yes | Input field references |
metricType | enum | No | base, derived, calculated |
format | object | No | Display formatting options |
tags | string[] | No | Categorization tags |
Calculated Dimension Schema
Calculated dimensions are stored in calculatedDimensions as a record:
calculatedDimensions:
  order_size_bucket:
    label: "Order Size"
    description: "Categorizes orders by amount"
    expression: |
      CASE
        WHEN {amount} > 1000 THEN 'Large'
        WHEN {amount} > 100 THEN 'Medium'
        ELSE 'Small'
      END
    inputs:
      amount:
        dataset: orders
        field: amount
dataType: string| Field | Type | Required | Description |
|---|---|---|---|
label | string | Yes | Display name |
description | string | No | Help text |
expression | string | Yes | SQL expression with {input} tokens |
inputs | object | Yes | Input field references |
dataType | enum | No | string, number, boolean, date, datetime |
Direct Template Editing
Power users can edit the domain template directly as YAML or JSON. This is useful for:
- Bulk edits: Rename multiple fields at once
- Version control: Store templates in Git for change tracking
- CI/CD pipelines: Automate domain updates as part of deployments
- Migration: Copy configurations between environments
For the complete field-by-field tutorial, see the Template Guide. For programmatic template generation (AI agents, scripts), see the Agent Guide.
To manage templates via the REST API, see the Domain Templates API.
Accessing the Code Editor
- Open your domain in the Domain Editor
- Click the Code Editor tab
- View and edit the full template as YAML or JSON
- Click Save to apply changes
Direct template edits bypass validation. Test thoroughly after making changes, especially to relationships and calculated fields.
Complete Template Example
Here's a full domain template for a sales analytics domain:
schemaVersion: "2.0"

datasets:
  - name: orders
    label: "Orders"
    description: "Customer order transactions"
    type: physical
    connectionId: "conn_abc123"
    connectionType: PostgreSQL
    schema: public
    table: orders
    primaryKey:
      - id
    fields:
      identifiers:
        - name: id
          label: "Order ID"
          dataType: number
          type: primary
        - name: customer_id
          label: "Customer ID"
          dataType: number
          type: foreign
      dimensions:
        - name: order_date
          label: "Order Date"
          dataType: date
          granularity: day
        - name: status
          label: "Status"
          dataType: string
      metrics:
        - name: amount
          label: "Amount"
          dataType: number
          sourceField: amount
        - name: quantity
          label: "Quantity"
          dataType: number
          sourceField: quantity

  - name: customers
    label: "Customers"
    type: physical
    connectionId: "conn_abc123"
    connectionType: PostgreSQL
    schema: public
    table: customers
    primaryKey:
      - id
    fields:
      identifiers:
        - name: id
          label: "Customer ID"
          dataType: number
          type: primary
      dimensions:
        - name: segment
          label: "Customer Segment"
          dataType: string
        - name: region
          label: "Region"
          dataType: string

relationships:
  - name: orders_to_customers
    sourceDataset: orders
    sourceFields:
      - customer_id
    targetDataset: customers
    targetFields:
      - id
    cardinality: many_to_one
    defaultJoinType: LEFT
    isAutoJoin: true
    discoveredBy: ai
    confidence: high
    isActive: true

calculatedMetrics:
  average_order_value:
    label: "Average Order Value"
    description: "Average revenue per order"
    expression: "{total_revenue} / NULLIF({order_count}, 0)"
    inputs:
      total_revenue:
        dataset: orders
        field: amount
        aggregate: SUM
      order_count:
        dataset: orders
        field: id
        aggregate: COUNT
    metricType: derived
    format:
      type: currency
      decimals: 2
      currency: USD
    tags:
      - kpi
      - sales

  profit_margin:
    label: "Profit Margin %"
    description: "Profit as percentage of revenue"
    expression: "({revenue} - {cost}) / NULLIF({revenue}, 0) * 100"
    inputs:
      revenue:
        dataset: orders
        field: amount
        aggregate: SUM
      cost:
        dataset: orders
        field: cost
        aggregate: SUM
    metricType: derived
    format:
      type: percentage
      decimals: 1
    tags:
      - kpi
      - finance

calculatedDimensions:
  order_size_bucket:
    label: "Order Size"
    description: "Categorizes orders by amount"
    expression: |
      CASE
        WHEN {amount} > 1000 THEN 'Large'
        WHEN {amount} > 100 THEN 'Medium'
        ELSE 'Small'
      END
    inputs:
      amount:
        dataset: orders
        field: amount
    dataType: string

  fiscal_quarter:
    label: "Fiscal Quarter"
    description: "Fiscal quarter based on order date"
    expression: |
      CONCAT('Q', EXTRACT(QUARTER FROM {order_date}), ' ', EXTRACT(YEAR FROM {order_date}))
    inputs:
      order_date:
        dataset: orders
        field: order_date
    dataType: string
Domain-Level Calculated Fields
Add reusable calculated metrics and dimensions directly to your domain template. These fields become available to all users across all dashboards that use the domain.
Adding Calculated Metrics
Define metrics in the calculatedMetrics section of your template:
calculatedMetrics:
  conversion_rate:
    label: "Conversion Rate"
    description: "Percentage of visitors who made a purchase"
    expression: "{purchases} / NULLIF({visitors}, 0) * 100"
    inputs:
      purchases:
        dataset: orders
        field: id
        aggregate: COUNT
      visitors:
        dataset: sessions
        field: visitor_id
        aggregate: COUNT_DISTINCT
    format:
      type: percentage
      decimals: 2
    tags:
      - marketing
      - kpi
Adding Calculated Dimensions
Define dimensions in the calculatedDimensions section:
calculatedDimensions:
  customer_lifetime_tier:
    label: "Customer Lifetime Tier"
    description: "Customer value tier based on total spend"
    expression: |
      CASE
        WHEN {lifetime_value} > 10000 THEN 'Platinum'
        WHEN {lifetime_value} > 5000 THEN 'Gold'
        WHEN {lifetime_value} > 1000 THEN 'Silver'
        ELSE 'Bronze'
      END
    inputs:
      lifetime_value:
        dataset: customers
        field: total_spend
    dataType: string
Best Practices for Domain Fields
- Document thoroughly: Include descriptions for every field. Users rely on this context.
- Use consistent naming: Follow a pattern like
metric_nameordimension_category. - Add tags: Group related fields (e.g.,
finance,marketing,operations). - Handle edge cases: Use
NULLIFfor division,COALESCEfor null values. - Test before publishing: Validate expressions with sample data.
Domain-level calculated fields appear in the Explorer with a Domain badge, distinguishing them from card-scoped or dashboard-scoped fields.
Next Steps
Once your semantic domain is configured:
- Train your users: Share the User Guide with end users
- Monitor usage: Track which relationships are used most frequently
- Gather feedback: Ask users which fields or relationships they need
- Optimize performance: Review query logs for slow multi-hop joins
- Expand gradually: Add new datasets and relationships based on user needs
- Automate with the API: Use the Semantic Domains API and Domain Templates API to manage domains programmatically